Bitcoin TA, stands for technical analysis. If you have been interested in investing in Bitcoin you may have come across various forms of technical analysis and commentary on price action.
It is important to understand what Bitcoin TA is, what it is not, how it can help you become a better investor and trader, and more importantly how to avoid losing money.
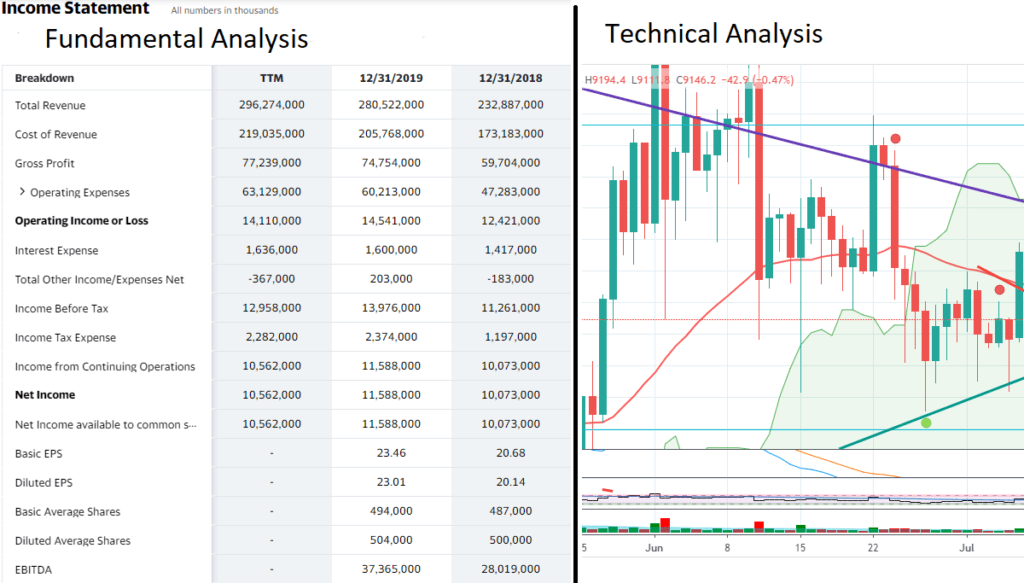
In the world of traditional investments (stocks, bonds, futures, and other instruments) traders and investors look to various types of analysis to determine good entry and exit points. When analyzing buying and selling opportunities traders broadly look at two categories of analysis – fundamental analysis and technical analysis.
Fundamental analysis tries to determine the intrinsic value and future potential of an asset, based on the business activities of the asset. Fundamentals will include debt/equity, earnings per share, price to earnings ratio, gross margin, and even activities like insider transactions.
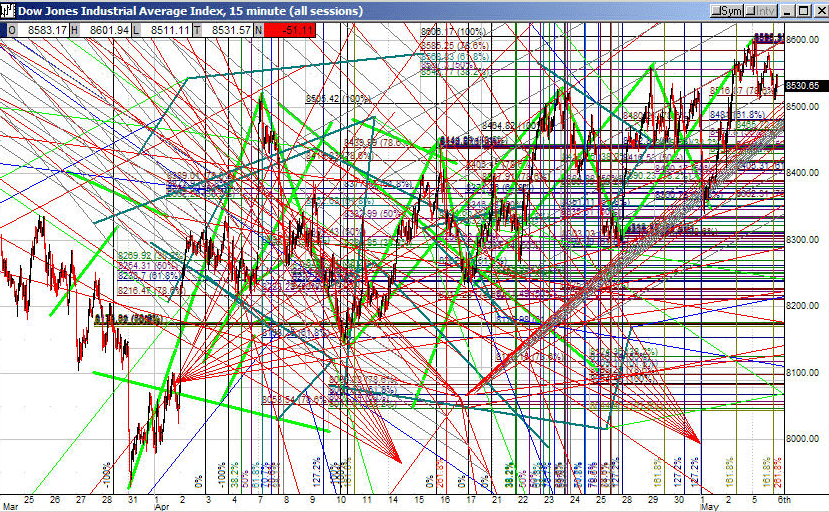
Technical analysis relies on the visualization of price action to help the trader determine the future direction of the price of an asset. Technical analysts use indicators such as trend lines, momentum indicators, and moving averages to help find patterns of behavior and predict future price levels.
Bitcoin Fundamental Analysis
Since Bitcoin is not a company that has debt, profit margins, and earnings, fundamental analysis looks different.
However, this is not to say fundamental analysis is impossible, in fact, quite the contrary.
Studying the fundamentals of Bitcoin requires a different set of metrics than a company, but still produces some amazing insights. Here are some examples of what might be included in looking at Bitcoin Fundamental Analysis –
- Difficulty Level – A measure of how much computing power was required to mine a Bitcoin block. As more miners compete to discover new blocks, the Bitcoin difficulty adjusts upwards. This feature also serves to secure the blockchain from attacks on the network.
- Miner Profitability – The more difficult a block is to mine the less profitable the miner as they used more computing resources to mine it.
- Transaction Fees – These are fees attached to each block paid to miners as an incentive for their services in securing the blockchain and verifying transactions. Fees can have an impact as price as they can indicate levels of demand using the network.
- Wallet Activity – This could refer to the tracking of any either unusual wallet activity on the blockchain that could involve very large transactions or the tracking of how frequently bitcoin is being transacted.
- Transactions per day – Total number of transactions per day.
There are many more potential fundamental type analysis techniques that can be applied to Bitcoin. I’d consider any type of On-Chain analysis of Bitcoin transactions, wallets, or any other type of blockchain activity fundamental analysis.
All of these metrics can help determine the overall value of the network.
Fundamental Analysis of Bitcoin can help you understand what insiders like miners and exchanges are doing, the security of the blockchain, supply and demand trends.
Blockchain Explorers are great sources of fundamental data on Bitcoin. Blockchain explorers allow users to view any blockchain transaction. Blockchain.com is a great resource for exploring blocks and related statistics pertaining to the blockchain.


Analyzing Bitcoin with fundamental analysis is overlooked by too many traders and investors. The ability to peer into the blockchain and see what other investors are doing is critical to the longer-term success of Bitcoin.
Although this article is an attempt to explain Bitcoin TA, it would be a disservice to the readers of this blog to not mention the power of fundamental analysis.
Bitcoin Technical Analysis (TA)
Because Bitcoin is not a company that has a marketing department and an R&D budget, many investors look to Technical Analysis to help understand the value proposition of the network.
This makes sense as the value of Bitcoin is directly related to its adoption, demand, and price.
Since Bitcoin shares many properties of currency, the price is even more critical than a company. In a company, they could have a secret plan to develop the best product the world has ever seen. The value would skyrocket the next day.
Bitcoin’s value is only determined by what holders are willing to pay for it.
The theory behind technical analysis is the human desires of fear and greed influence buying and selling behavior. These behaviors then result in predictable price patterns reflecting the motivations of the investors.
Technical analysis holds that these predictable price patterns can be plotted visually on a chart. These chart patterns can be used to determine a trend, find a profitable entry point, and mitigate risk.
Candlesticks, Trend Lines, and Moving Averages
Technical analysts use a great diversity of tools to help them determine good entry and exit points.
Candlesticks are one of the most popular charting tools. The Candlestick chart type is aptly named this as the price movement of the asset is visualized as a candle with a body and wick.
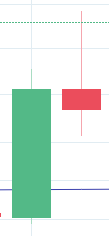
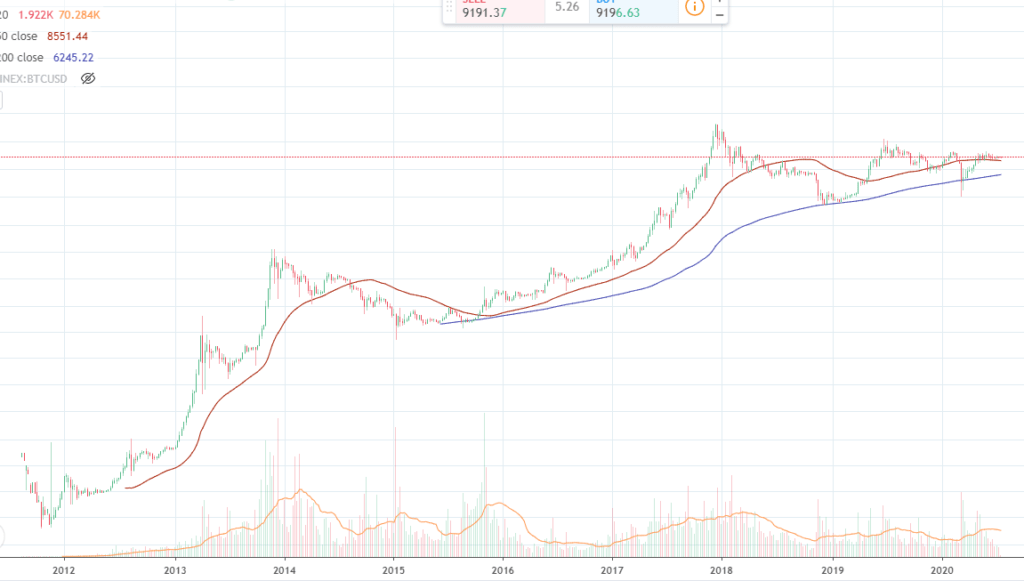
Price action for whatever period you are viewing (5 minutes, 1 hour, 1 Day, etc) is marked by the shape of the candle. Take look at image 1.1 above, these are daily Bitcoin candles.
On a green candle, the day would start at the bottom of the “body” of the candle and end at the top of the body of the green candle. Note the “wick” of the candle, this indicates a period during that day in which the price was higher than the close of the day, but it eventually came down.
On the red candle, the day starts at the upper portion of the candle body and ends at the lower portion of the candle body.
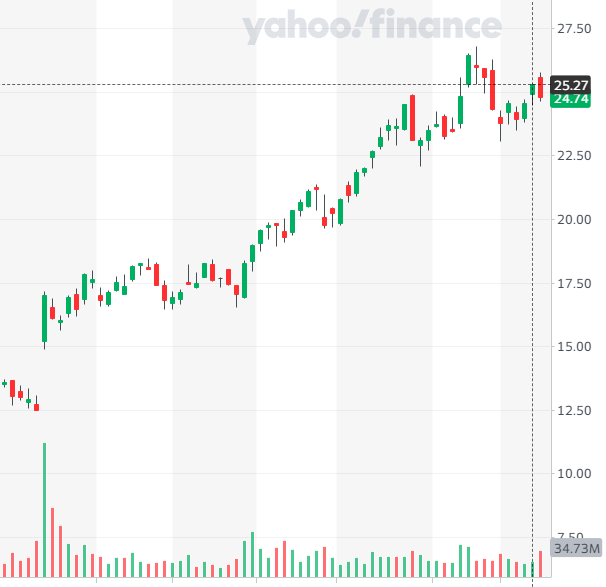
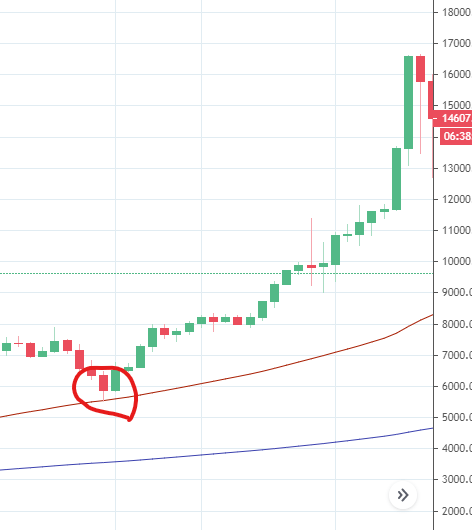
Candlestick patterns can hold powerful signals in their patterns that allow investors to identify potential buying and selling opportunities. For example, the hammer pattern (looks like a Hammer) seen in figure 1.2.
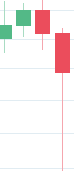
The hammer is a particularly powerful candlestick pattern that indicates during the course of this period the price dropped aggressively but was reversed with strong buying action.
You can see this particular hammer patter in Bitcoin turned out quite nicely. In a later article, I will outline more candlestick patterns that traders use to find good entry and exit points.
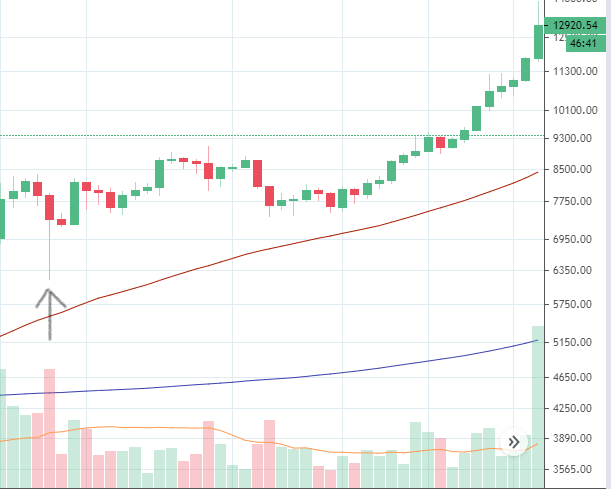
Asset markets are also known to trend in a particular direction. Trend lines help analysts realize these trends and give them a framework for understanding at what price levels they will find support from buyers and resistance from sellers.
When drawing a trend line in a bullish market like the image above, analysts will connect the candlestick lows just below the body of the candles.
Trend lines in bearish markets are connected by finding the line that intersects the high candles. In general, trend lines can intersect a wick, but do not always, in general lines that produce the most contact points work the best.
Trendlines are not an exact science, but it can be very helpful in understanding where you can minimize your risk.
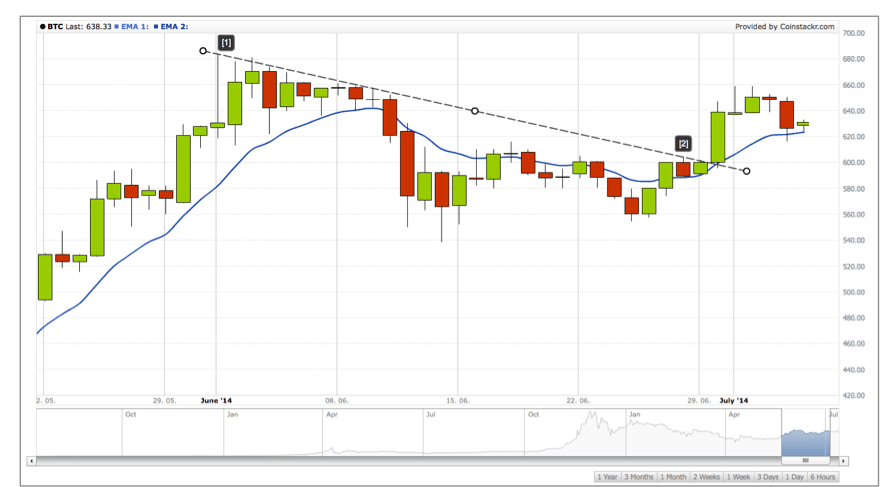
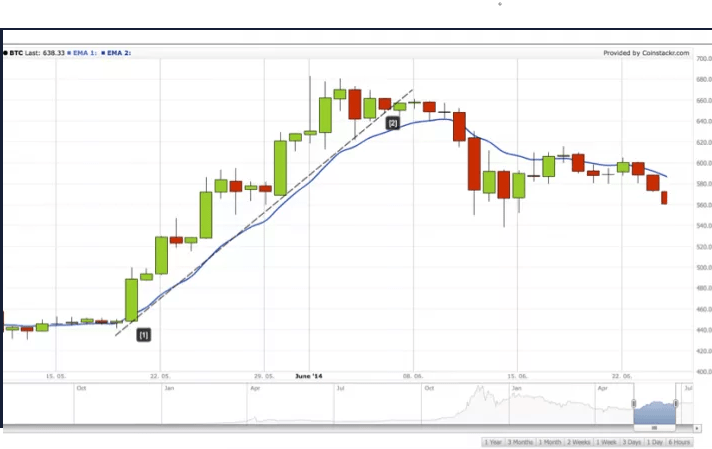
The last technical tool I will briefly mention is moving averages.
Moving averages are a lagging indicator that smooths out price action over a longer period of time. Analysts will use a variety of time frames but in general, the 200 period, 50 period and 20 period are the most popular.
Trend lines help traders determine overall directionality and market condition. TA traders will also look to these lines as major areas of support and resistance. In an uptrend, the price will often rebound off periods like the 20 day moving average as bulls find it an opportunity to enter a bull run at a decent price.
Should I trade Bitcoin?
I used to trade Futures and ETFs for 3 years. This was before I become a long term investor.
Trading is extremely difficult and requires incredible amounts of patience and discipline. Many naive traders including myself, will over the longer term lose money.
I was “unfortunate” enough to make money for my first two years of trading. My 3rd year wasn’t as pretty.
This was a valuable and expensive lesson that I am very grateful to have had. Notice, the name of the website is the Bitcoin Investors, not the Bitcoin traders!
Most novice traders will spend enormous amounts of time analyzing charts, trying to figure out exit and entry points, creating special indicators that they believe will lead to success. To make my point clear read the following sentence out loud 10 times.
99% of successful trading comes down to successful money management.
Traders need to create detailed plans related to the following before they even think about taking a position.
- How much of your capital are you willing to risk on each trade?
- What is your entry point(s) and exit point(s) and why do these price levels matter?
- What is your estimated probability of the trade going in your direction?
- At what price will you apply a stop loss if the trade goes against you?
- Will you adjust your stop loss to break-even at some point, if so when?
- How will you exit the trade? (at a certain price level, with a trailing stop, is there more than one price target?)
- What is your time horizon for the trade? Will you abandon the trade if the market doesn’t move in the time horizon you are expecting?
I find that traders will often rely too much on indicators rather than understanding money management. Indicators only derive as much meaning as you are willing to give them.
Being a good trader isn’t so much about being “right” as it is about managing your money.
You can be right 70% of the time and bad money management can send you into a drawdown you will not be able to get out of if you risk too much on the losing 30%.
I recommend reading one of Van Tharp’s trading books or trading courses. Regardless if you decide to become a trader, these books are a great read. Van Tharp focuses on the money management side of trading and understanding how risk and position size have everything to do with your trading success.
To be clear, I am not a 100% buy and hold for life investor. I believe in trading on a macroeconomic level.
I hold my trades for months, years, or even decades. The shorter your time preference for holding assets, the more risk you take on.
Using TA as an Investor
Using technical analysis does not have to solely live with short term day traders and swing traders.
TA can help investors determine popular price levels, good entry points, exit points, and an assessment of their long term positions.
Great investors are great researchers.
When you are able to combine ideas from fundamental analysis and technical analysis along with research on macro global trends you can begin to structure your portfolio and positions for success.
The power of technical analysis gives investors insights into choosing opportunities that help them minimize risk.
Even when investing for long periods of time, one needs to have a game plan that includes when they are going to enter markets, and how they will diversify. Learning TA can give you an edge when buying, selling, and maximizing every penny to your advantage.
Another benefit of learning is it will help you minimize stress in your investing. If you can identify various market phases you can have a better idea of how to cope with them as your net-worth fluctuates. This has helped me tremendously with Bitcoin!
Analyzing Bitcoin becomes particularly powerful when you assess the fundamental infrastructure along with the price action.
One of my favorite analysts that has helped me made some wise decisions and increase my net worth dramatically is Willy Woo. His website WooBull, provides free charts with various price models for Bitcoin. I highly recommend checking out his site.
This website is a tremendous resource for anyone interested in how technical analysis can be combined with fundamental blockchain activity to provide a complete view of the Bitcoin price action.
Please read our disclaimer here regarding investment advice and risk. Disclaimer: This should not be construed as or relied upon in any manner as investment, legal, tax, or other advice. Please consult an appropriate tax or financial professional to understand your personal tax and financial circumstances. I may get compensated by some platforms mentioned below (because of referral links). Do your own research