
Is the price of Bitcoin in a bubble, again?! What do you think is more probable?
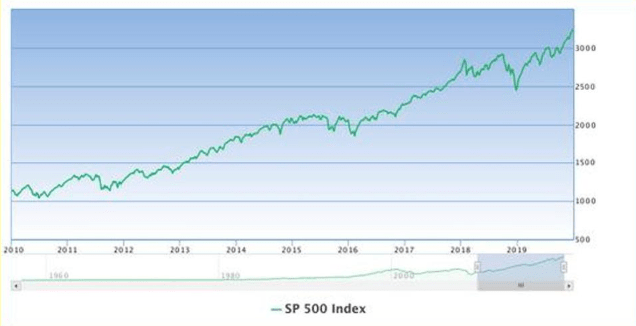
- Scenario 1: The price of Bitcoin steadily increases overtime at a rate of 20% per year since it’s inception. The price would never be in a “bubble” but rather a model of steady growth up and to the right. Take a look at the chart below graphing the SP500 over the last 10 years. In this scenario, users steadily get on board and demand follows a uniform pattern. As the confidence of the masses increases so does the price of Bitcoin.
- Scenario 2: The price of Bitcoin goes through a series of dramatic bubbles. Periods of fear and greed dominate the market cycles as supply and demand shift greatly and suddenly from month to month. Fortunes are made and lost. News, hype, and adoption come in cycles each one slightly less dramatic than the last as stability comes over the long term.
As you may already have already guessed, Bitcoin has tracked closer to scenario number 2. You have likely heard that the price of Bitcoin was in a bubble and would never recover.
Google search the term Bitcoin bubble and you will see Bloomberg and Cnn articles about the great Bitcoin bubble that popped! Would it surprise you to hear that in history, Bitcoin has experienced 4 bubbles?
Let’s take a closer look at the bubbles of Bitcoin.


Bitcoin Bubble #1

It is challenging to find price charts that go back this far as Bitcoin was created in 2009 and wasn’t readily traded on public exchanges.
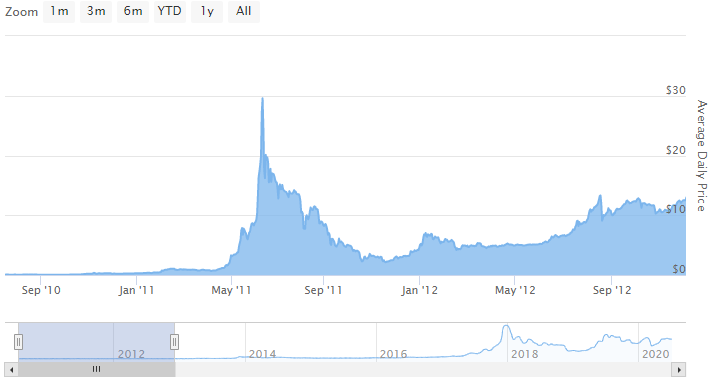
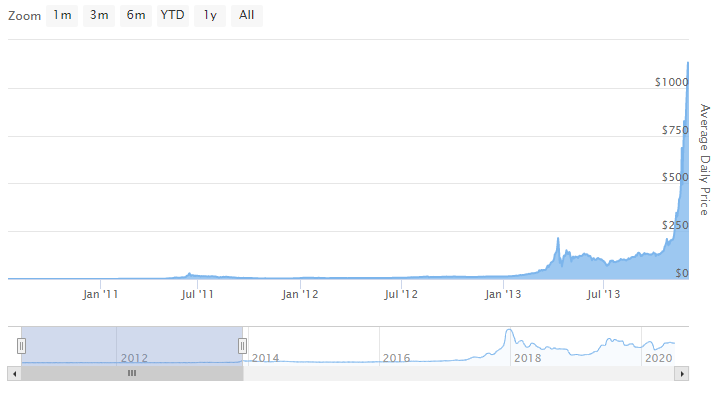
For most of 2010 the price of Bitcoin went from around .07 cents, up to about.30 cents per coin. The action started heating up in 2011 as the price steadily climbed into to just shy of $1. In Bitcoin’s first bubble, during June of 2011, the price of Bitcoin spiked all the way up to $30 per coin.
What happened in the aftermath, did the bubble burst and Bitcoin go to $0?
Nope, As you can see from the chart below an aggressive sell-off occurred in subsequent months with the price bottoming out at around $2.14 cents or so.
After bottoming out, the price stabilized and rose steadily leading into the first Halving event of November 2012. I am not going to get into block reward halving events in this article, but I will point out that these have historically served as a catalyst for rocketing price action.
Bubble #1 Price Top – $30
Subsequent low – $2.14
Correction Percentage – 93%
Time from launch of Bitcoin to top of Bubble #1 – 880 Days
Bitcoin Bubble #2
Bubble Number two happened slightly after the first Bitcoin block reward halving.
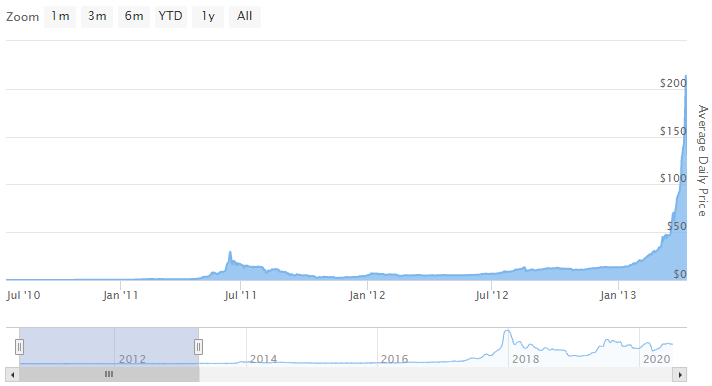
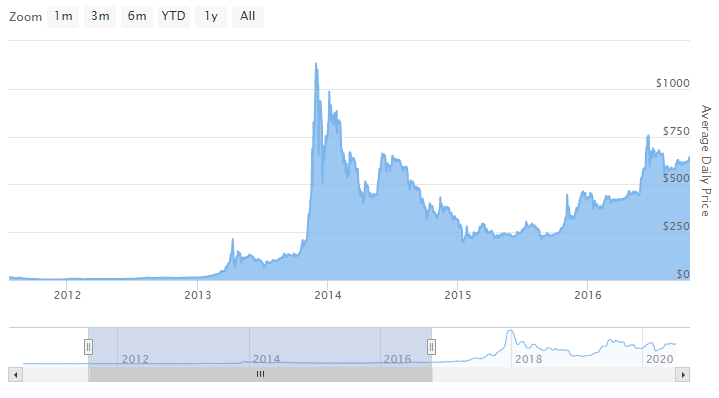
The price sky took off “to the moon” from the previous low of $2.14 up to a high of around $258. The beginning of this bubble’s accent was also in coordination with Cyprus Bailout of March 2013*.
After bubble number 2 burst, the price came screeching down to around $64. However, this bubble proved just to be a slight pullback as part of a larger move. The price stabilized at around $120.
Bubble #2 Price High – $258
Subsequent Low – $64
Correction Percentage – 75%
Time from previous High to Bubble #2 – 664 Days
Bitcoin Bubble #3
You could make the argument that Bitcoin bubble 3 is actually the real high of Bitcoin bubble number 2.
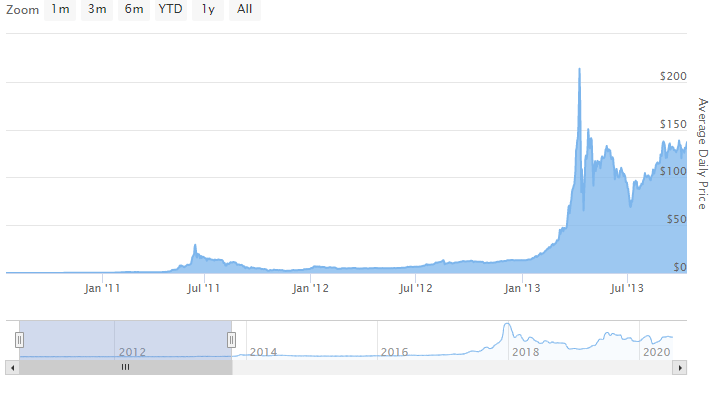
However, a fair amount of time separates them and I believe they are two unique adoption based events. At the top of bubble #3, the price on Mount Gox Bitcoin exchange was $1242.
This bubble was extremely important for Bitcoin, this is when the media began to air stories of this strange alternate magic internet money. During this time, the fringe financial institutions began taking an interest and many fortunes were made.
According to the popular media at the time, the bubble burst of 2013 was the burst to end Bitcoin. A couple of months later the most popular Bitcoin exchange, Mount Gox, imploded, declaring bankruptcy and that they had lost the private keys for much of their investor’s Bitcoin.
The price action led Bitcoin down to a low of around $150 in January of 2015. After, Bitcoin found stability in the $200-$600 range.
Bitcoin Bubble #3 High – $1242
Subsequent Low – $150
Correction percentage – 88%
Time from Previous High to Bubble #3 – 231 Days
Bitcoin Bubble #4
In 2015 and 2016 Bitcoin regrouped and began to stabilize in price.
These two years mark a period market analysts call “accumulation.” All markets go through these accumulation phases, including Bitcoin in each of it’s bubbles.
Accumulation is also called “basing” and it occurs when sellers have run out of steam and short-sellers begin covering their positions. Usually, the longer the accumulation phase is, the more explosive the breakout.
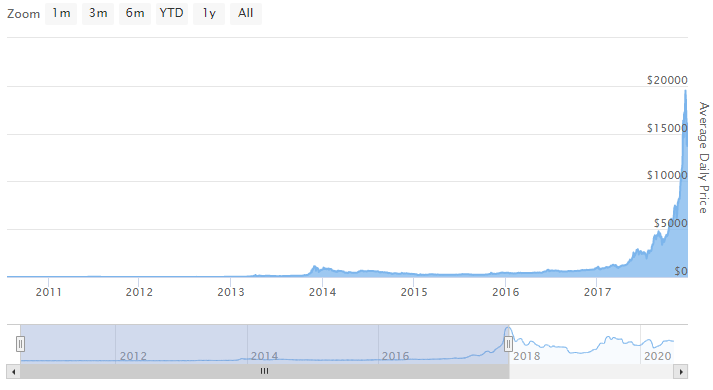
The Bitcoin bubble of 2017 is perhaps the most famous of Bitcoin’s bubbles.
This bubble peaked right at the end of 2017 and marks the era of Bitcoin entering the mainstream conversation. The price during this phase peaked at around $20,000 US dollars on most exchanges.
If you hear the phrase now (in 2020), that the “Bitcoin bubble popped” they are likely referring to the bubble of 2017 as this one represents the largest bubble in terms of market capitalization.
The total value of USD held in Bitcoin went from $320 Billion dollars to around $60 Billion in March of 2019. on December 15th of 2018, Bitcoin set a recent low of around $3,100.
Since the low of $3,100, Bitcoin has fought back impressively to stabilize between $6,000 and $10,000.
Bitcoin Bubble #4 High – $19,891
Subsequent Low – $3,100
Correction percentage – 84%
Time from Previous High to Bubble #4 – 1477 Days
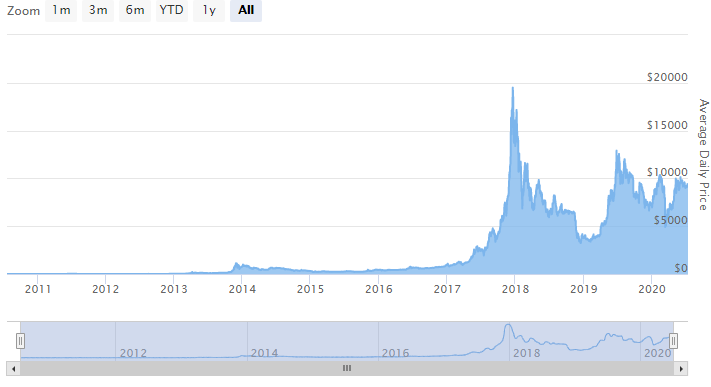
What is next for Bitcoin? Bubbly anyone?
At the time of writing It has been 941 days since the last Bitcoin high. There are currently two theories about what could shape Bitcoin’s next bubble.
The Bitcoin block reward (reward paid out to Bitcoin miners) was cut in half on May 11th, 2020. With this dramatic cut in supply, analysts predict we could see the beginning of the next Bitcoin bubble in the near term.
While not dismissing the “stock-to-flow theory” relating Bitcoin’s price action to supply-side economics of the equation, other analysts suggest the Bitcoin bubbles are becoming greater in duration and reduced in volatility as the price goes up.
This theory suggests as the large numbers behind Bitcoin’s price grow and Bitcoin becomes more established, price action moves slower and less dynamically. I guess we’ll have to wait and see!
Please read our disclaimer here regarding investment advice and risk. Disclaimer: This should not be construed as or relied upon in any manner as investment, legal, tax, or other advice. Please consult an appropriate tax or financial professional to understand your personal tax and financial circumstances. I may get compensated by some platforms mentioned below (because of referral links). Do your own research